IT professionals need tools that help them diagnose and fix problems that occur in their networks. Devices become overloaded or go down. Network links become saturated or broken. Device configurations get lost or modified. Critical services go down.
UVexplorer provides a suite of diagnostic tools to help you quickly find the root cause of a problem, and get it resolved. The following tools come built-in with UVexplorer:
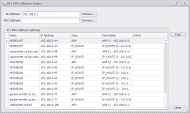
IP/MAC finder: Search your network to learn what device(s) a specific IP or MAC address belongs to. For example, if a device with a particular MAC address is consuming too much network traffic, this tool can show you which device that MAC address belongs to.
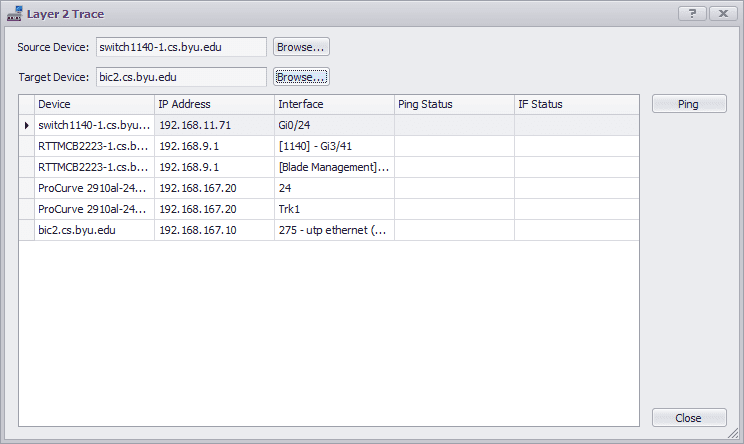
Layer-2 Trace: Trace the hop-by-hop network path between any two devices in your network. This tool can provide insight into why a device might not be reachable from another device on the network.
Start vs. Run Config Comparison: View the differences between the “starting” and “running” configurations of a network device, such as a switch or router. This tool can show you what changes have been made to a device’s configuration since it booted, but have not been saved to its “starting” configuration.
Capture Config: Backup the “starting” and “running” configurations of a network device, such as a switch or router. Keeping backups of device configurations allows you to restore device configurations in the event that a device’s configuration becomes corrupt or lost.
DNS/Hostname Audit: Test and verify your DNS server’s configuration. Given an IP address range, it performs both forward and reverse DNS lookups, and shows you the results. You can scan the results for potential problems.
SNMP MIB Walker: Browse a device’s SNMP MIB values. Use this tool to learn about a device’s operation, or to diagnose problems that might exist with the device.
PING Status: Send a series of PING requests to one or more devices, and view a graph of each device’s response (RTT) times.
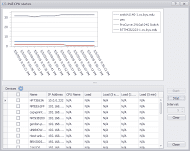
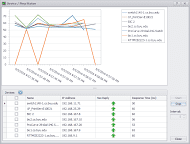
CPU Load Test: Plot the CPU load for one or more devices over a period of time. This tool helps you measure the load that each device is under, and whether a device might be overloaded and thus unable to function properly.
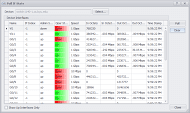
Real-Time Interface Status: View statistics for all of the network interfaces on a selected device. This tool displays all of the network interfaces on the selected device, the speed and status of each interface, and also inbound and outbound network traffic statistics.
Together, these tools provide a powerful toolkit with which to analyze and understand your network.