PRTG Network Monitor is a popular network monitoring platform that can be streamlined and optimized to target just what you need for simple and accurate network monitoring. However, your IT infrastructure is ever growing and changing. Keeping your PRTG server configuration up-to-date with those changes can be a difficult, if not overwhelming, task. For example, each time critical devices are added to your network, new sensors need to be created. And, if you need to distribute the monitoring load among multiple PRTG servers, the task of keeping your PRTG server configurations up-to-date is even more challenging.
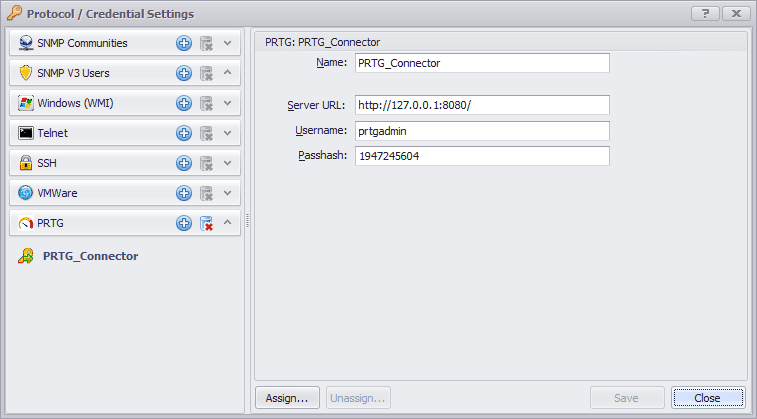
With UVexplorer’s PRTG Connector, you can control one or many PRTG Network Monitor servers from one UVexplorer console. By simply creating PRTG Connector targets, you can connect UVexplorer to as many PRTG servers as you want.
UVexplorer’s fast and detailed network discovery can build a complete network model of your IT infrastructure within minutes. But, instead of having to monitor those devices from one central location, UVexplorer helps you distribute the monitoring load across multiple PRTG servers. This is done by exporting discovery results from UVexplorer to multiple PRTG servers distributed across your IT infrastructure. When exporting discovery results to PRTG, UVexplorer automatically creates and configures device groups, network maps, and sensors in the PRTG servers that you specify. This lets you create efficient and targeted monitoring policies using multiple PRTG servers.
Along with having multiple PRTG servers comes the never-ending task of keeping their monitoring configurations up-to-date. When devices are added to your network, new sensors must be created to monitor the new devices. Similarly, when devices are removed from your network, sensors must be deleted. UVexplorer’s scheduled discovery feature provides the ability to continuously run network discoveries and then export those results/changes to multiple remote PRTG servers. Never be caught by surprise by a dynamically added server. UVexplorer will automatically discover and configure a monitor policy for the new devices on whatever PRTG server you choose. (Yes, and network maps can be kept up-to-date too.)
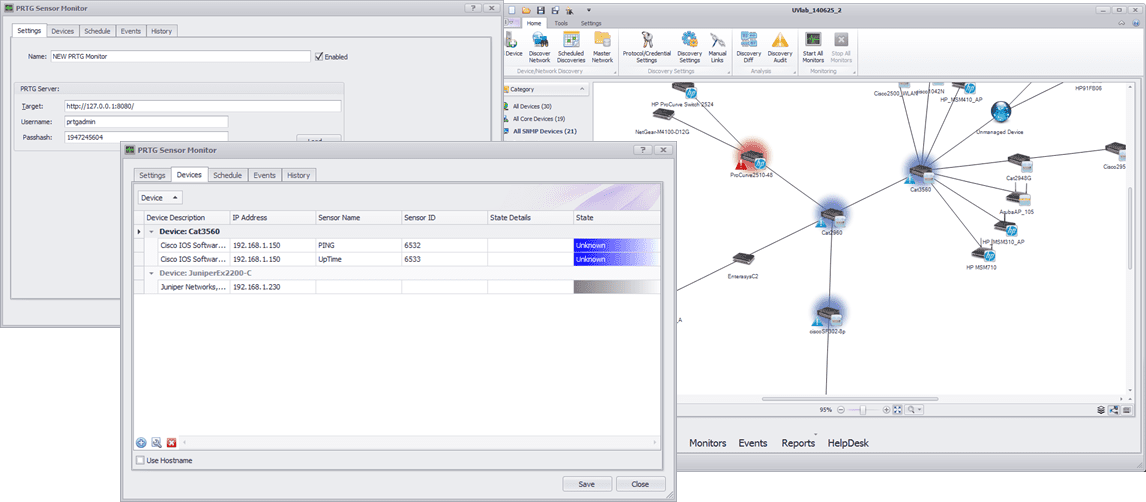
So, now that multiple servers are up and running, how can you see the overall status of your network devices? With UVexplorer, this is simple. UVexplorer can be configured to “monitor” device status from one or many PRTG servers. By creating a PRTG Status Monitor, UVexplorer can be “linked” to devices that are monitored on any of your PRTG Network Monitor servers. This monitor will allow UVexplorer to pull device status directly from PRTG and display that status within the UVexplorer console. The device status imported from PRTG is automatically displayed on UVexplorer’s network maps, as well as in other views within the UVexplorer user interface. A device’s status can be configured to reflect a roll-up of all the device’s PRTG sensors, or to reflect a select subset of the device’s PRTG sensors. This allows you to view device status from multiple PRTG servers within a single UVexplorer console.