
If you monitor your network with PRTG Network Monitor, UVexplorer makes a great companion product to PRTG. In addition to exporting devices, sensors, and maps to PRTG, UVexplorer can also query device status (Up, Down, etc.) from PRTG so that device status can be viewed within UVexplorer’s maps and reports. This allows PRTG’s powerful monitoring platform to enhance UVexplorer’s network discovery and mapping capabilities.
At any point in time, PRTG can tell you what the overall status of a device is (Up, Warning, Down, Paused, etc.). If you want to display device status within UVexplorer, you can create one or more PRTG monitors that query device status from PRTG on a regular schedule (e.g., every 5 minutes). For example, suppose you want to display the state of your core networking devices in UVexplorer (routers, switches, firewalls, etc.). To do this, go to UVexplorer’s Monitors tab, and create a PRTG Monitor on your core networking devices. Give it a schedule that meets your needs (e.g., every 5 minutes). Every time this monitor runs, it will query the state for the specified devices from PRTG, and store the state information in the UVexplorer database. UVexplorer will then display these device states within its maps and reports.
To create a PRTG Monitor, do the following:
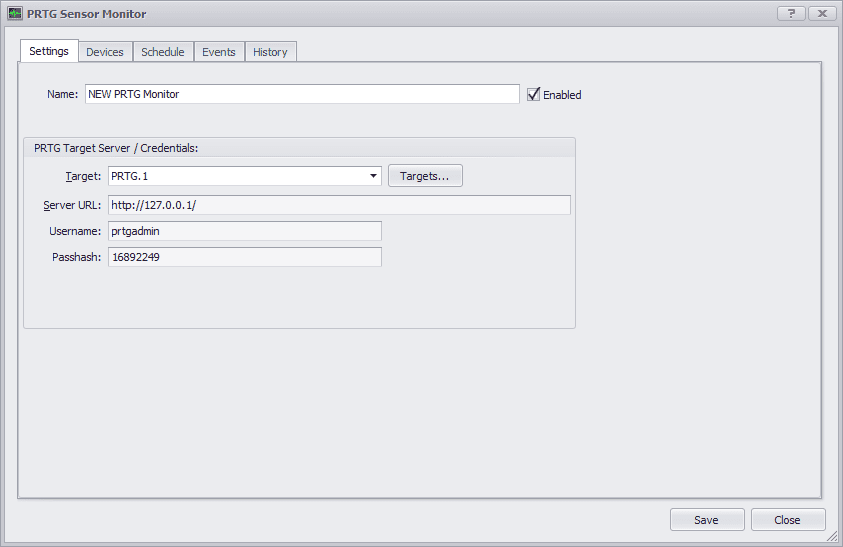
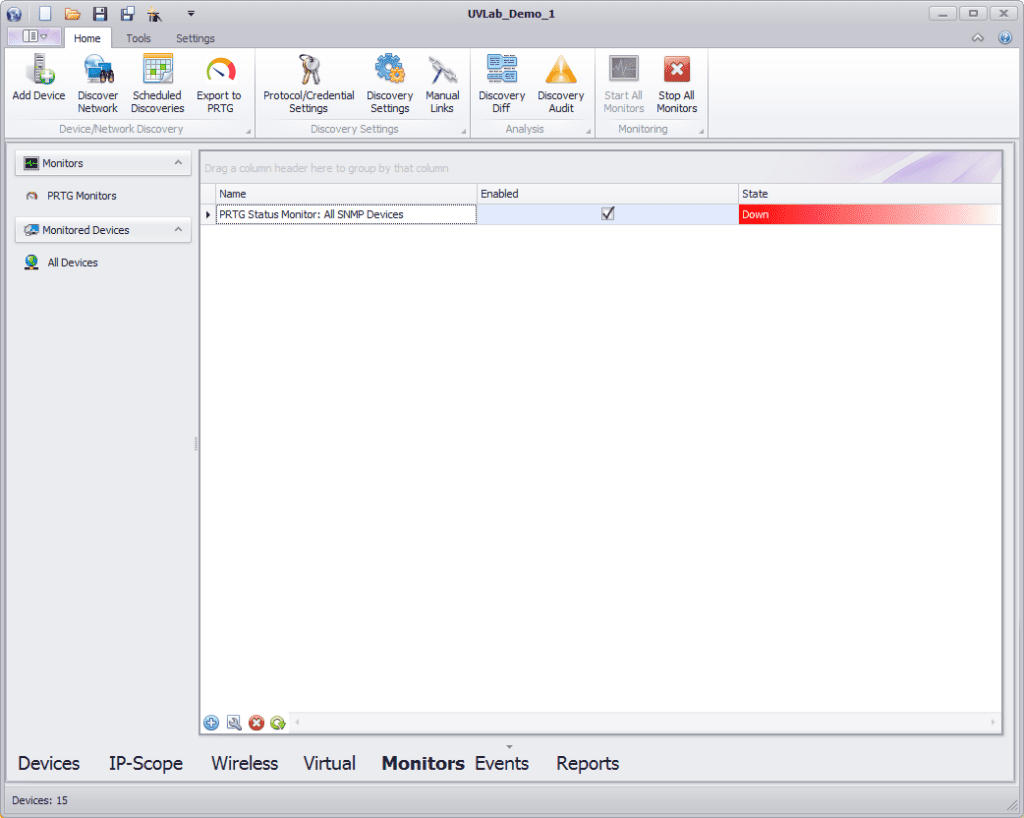
After creating a PRTG Monitor, you can view the status of the monitor’s devices (according to PRTG) in the UVexplorer user interface (see images below).
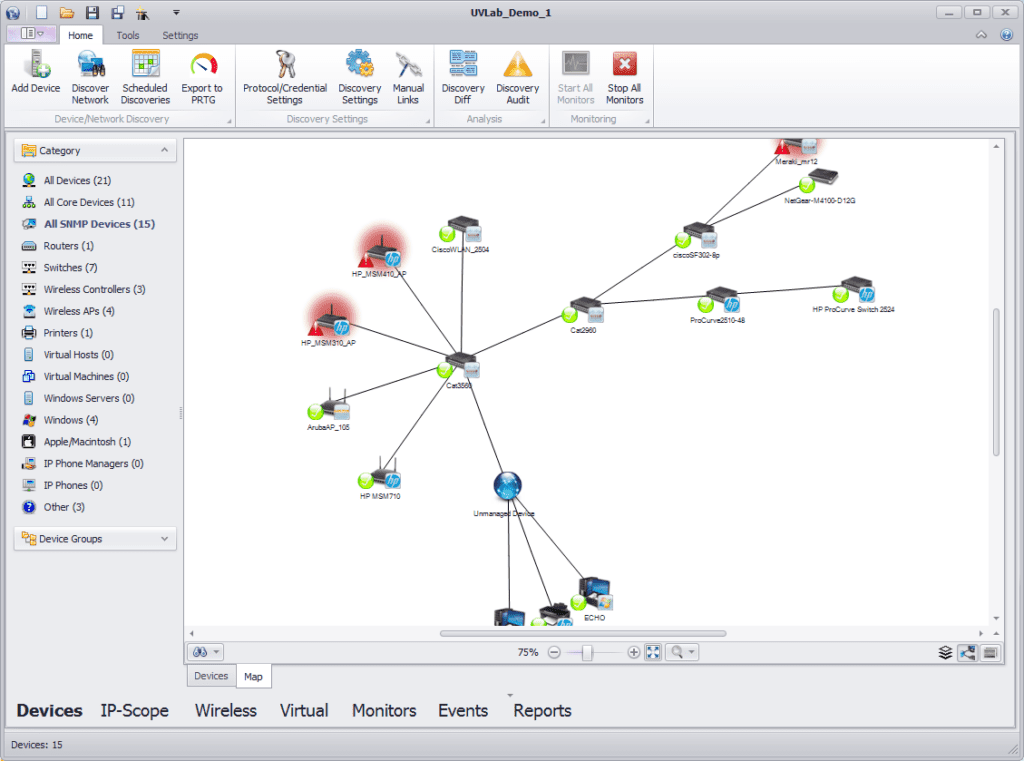
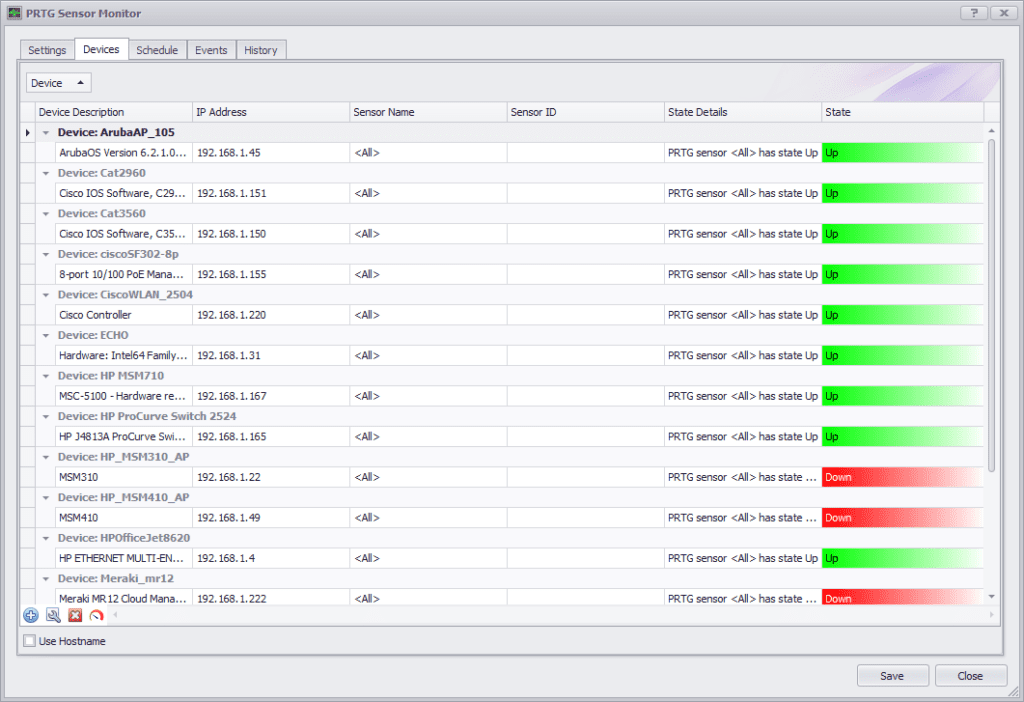
You can also view the history of a PRTG monitor by right-clicking on the monitor, and selecting the “PRTG History” option from the context menu. This report displays a state history for each device in the monitor. This lets you see how the state of each device has changed over time (see image below).
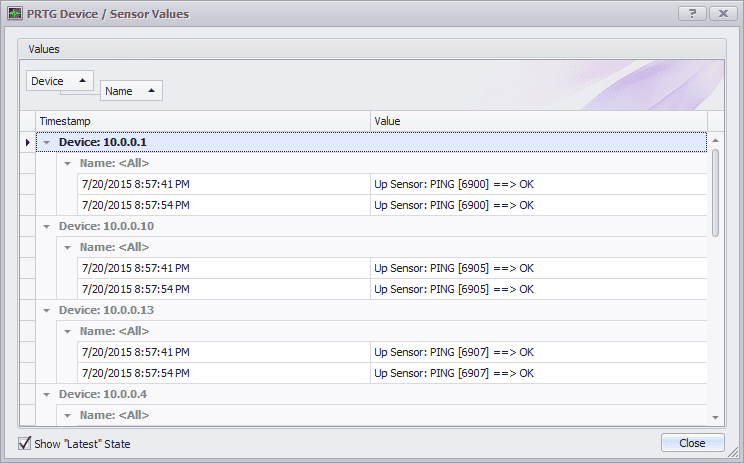
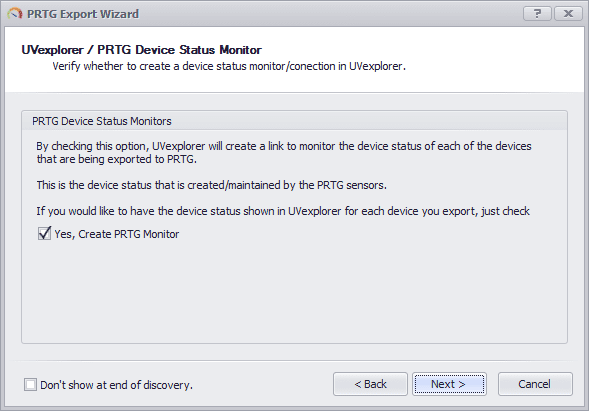
When you export devices to PRTG, you are given the option of having UVexplorer automatically create and configure a PRTG Monitor on all exported devices so that you can view the states of those devices in UVexplorer. If you use the PRTG export wizard to do your export, the wizard will ask you if you want UVexplorer to auto-create a PRTG Monitor on the exported devices. Or, if you export directly from a map by selecting “Export to PRTG”, the export form give you the option of auto-creating a PRTG Monitor on the devices. Either way, after completing the export, you can go to UVexplorer’s Monitors tab, and see the auto-configured PRTG monitor (see images below).
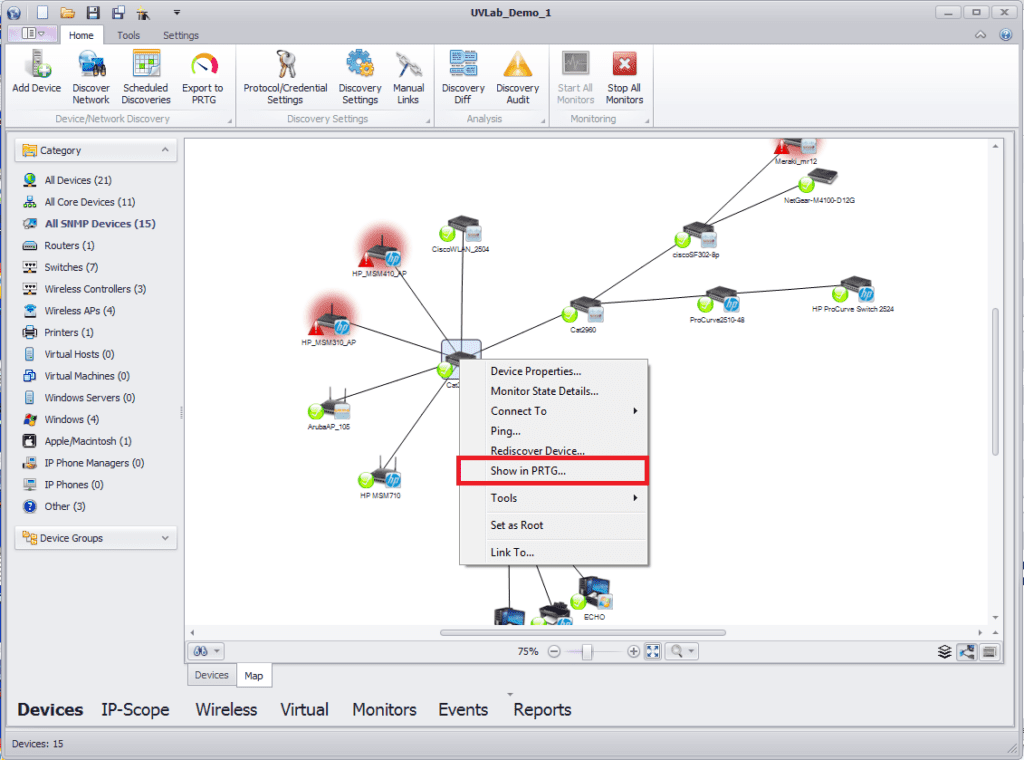
When using UVexplorer with PRTG, it is often convenient to jump between the two environments. For example, if UVexplorer shows a device as being “Down”, you will probably want to jump into PRTG to further investigate the situation. To make this easy, in UVexplorer you can right-click on a device, and select the “Show in PRTG” option. Doing this automatically opens PRTG in a web browser, and displays the PRTG device corresponding to the selected UVexplorer device. You can then inspect the states of the device’s various PRTG sensors. This works in both UVexplorer device lists and maps (see image below).
All Rights Reserved. UVnetworks © 2015 – 2025